
Deployment of an APM based on Kubernetes (Prt1)
What is Kubernetes monitoring and the most open source tools used ?
This article shows how the deployment of an Application Performance Monitoring (APM) solution for a Kubernetes -based application works to detect and fix issues related to that application.
The notion of continuous deployment in the DevOps technique is of particular significance to this project. Which calls for the use of a deployment environment with Docker and Kubernetes and the operation part which concerns the deployment into production of the application and its exposure to clients with a reverse proxy and the monitoring part concerning the integration of an APM solution to manage the performance of the application.
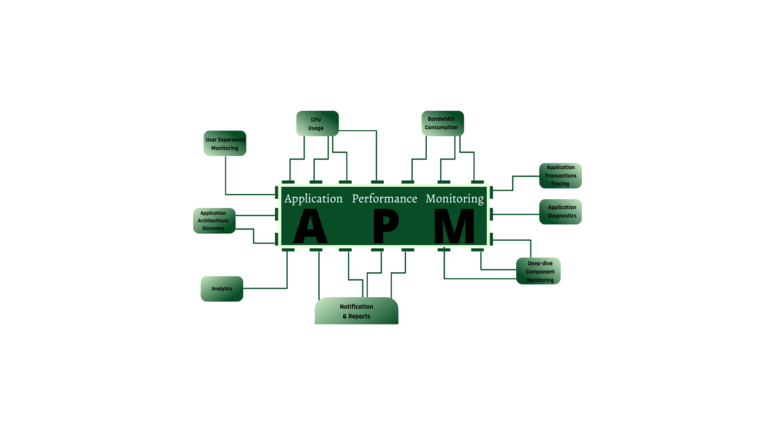
The Application Performance Monitoring, or APMs, are data-driven tools for monitoring and managing application performance, transaction time and user experience.

Kubernetes monitoring
Kubernetes is a free and open source container orchestration system that automates the deployment, scaling and administration of containerized applications. The Cloud Native Computing Foundation currently maintains it, which was initially create by Google.
Given the complexity of kubernetes, the increased popularity of microservices makes monitoring more difficult. Infrastructure, clusters, nodes and pods (container applications) are all things that must be kept track of. As a result, we require a system that allows us to track each individual component while also alerting us to any issues.
Benchmarking
Among the open source solutions used for k8s monitoring:
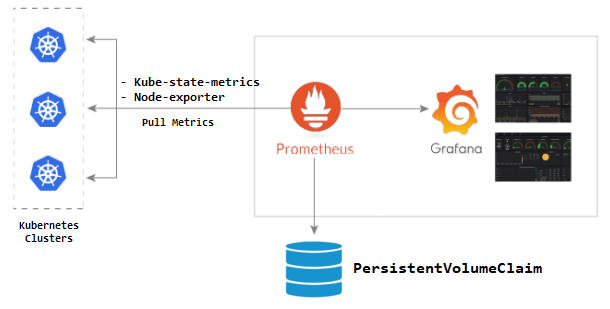
Prometheus + Grafana
SoundCloud created Prometheus, which is an open source monitoring and alerting platform. Many enterprises and organizations have embraced Prometheus since its start in 2012 and the project has a thriving development and user community. It is currently a stand-alone open source project with no companies at all. Prometheus joined the CNCF in 2016 as the second hosted project after Kubernetes, to emphasize this and explain the project’s governance structure.
Prometheus collects and saves metrics as time series data, which means the metric data is save alongside the timestamp at which it was taken, as well as optional key-value pairs call labels. Grafana is often connect with Prometheus.
Grafana is a metric display tool that can also use to create alerts. It can also send a notification via Slack, webhook, email, or other channels. as well It is able to query multiple entities simultaneously.
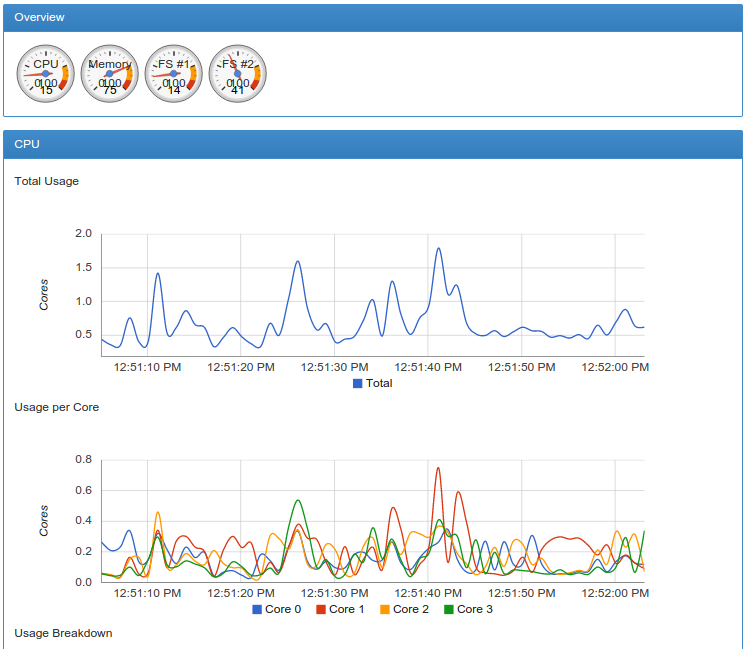
Monitoring k8s clusters with Prometheus + Grafana:
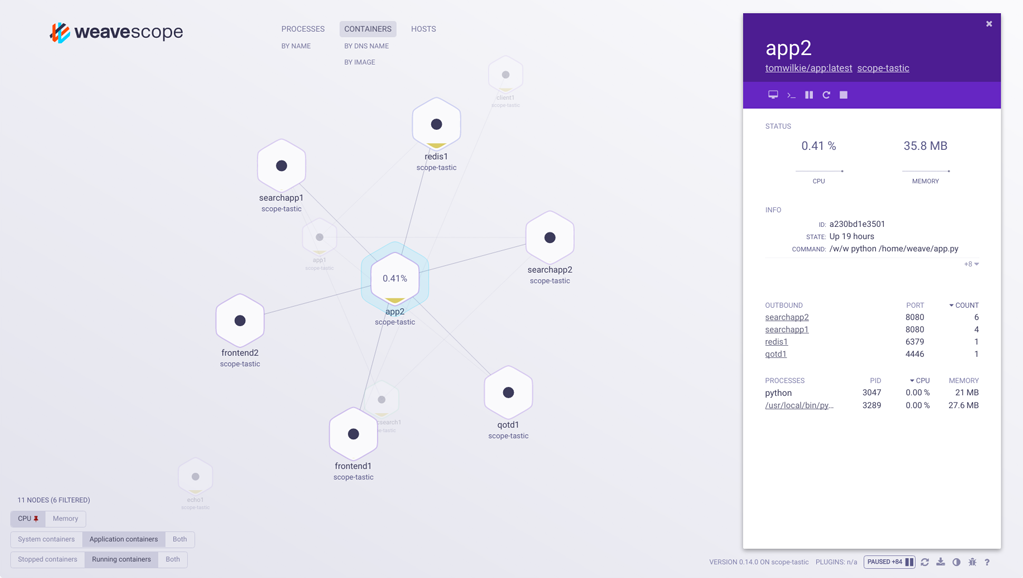
Weave Scope
A troubleshooting and monitoring tool for Kubernetes. It establishes logical topologies for your application and infrastructure, making it simpler to manage, monitor and control your microservice-based containerized app. It provides a comprehensive view of both the application and the complete infrastructure.
ELK stack
The ELK stack is one of the most popular open source log management solutions, especially for Kubernetes. But it can easily be use and it is also use by many for surveillance purposes. This is a set of four tools that provide an end-to-end log pipeline.
Elasticsearch is a distributed RESTful search and analytics engine that can be used for a variety of purposes. And their list just keeps growing. The keystone of the Elastic Suite, it centralizes data storage and ensures ultra-fast research, great relevance and analyzes that are as powerful as they are scalable.
Logstash is a server-side data processing pipeline whose primary mission is to ingest data from a multitude of sources, then transform it and send it to the Elasticsearch storage system.
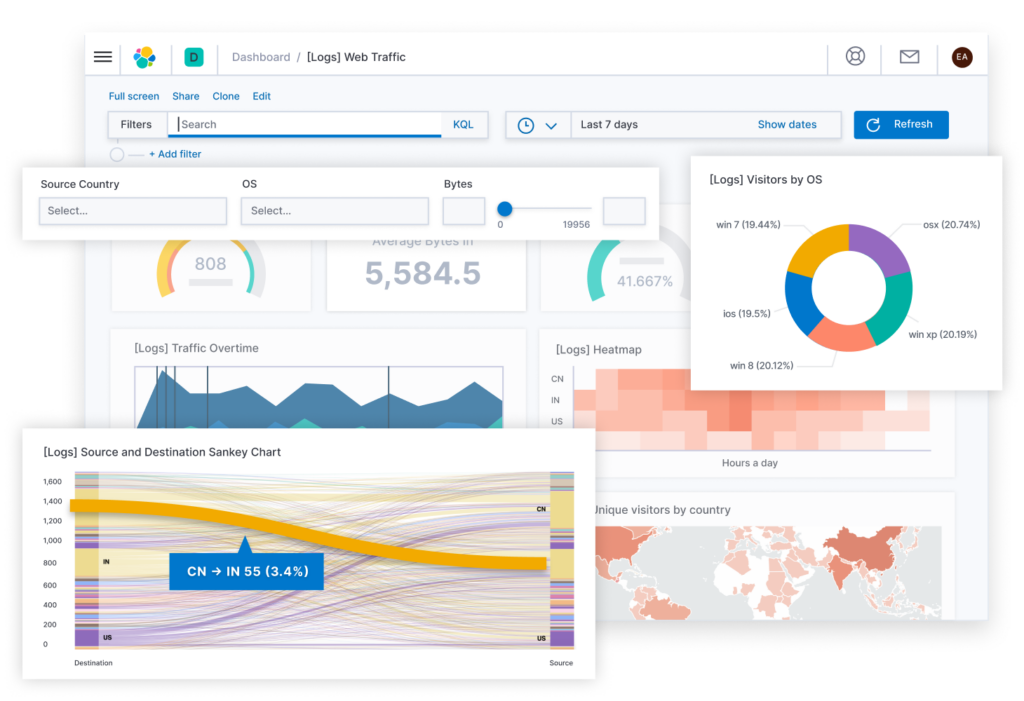
Kibana is an Elasticsearch data visualization plugin distributed under the Apache Free License version 2. It allows you to visualize content that has been indexed in an Elasticsearch cluster. Users can create bar charts, line charts, point clouds, pie charts and large data maps.
cAdvisor
cAdvisor is designed to assemble, process and export resource usage and production information on running containers. It is also develop in Kubernetes and integrated with the Kubelet binary.
cAdvisor is not deploye by pod but at node level, it will automatically determine all running containers on a system and collect system metrics like memory, CPU, network etc.
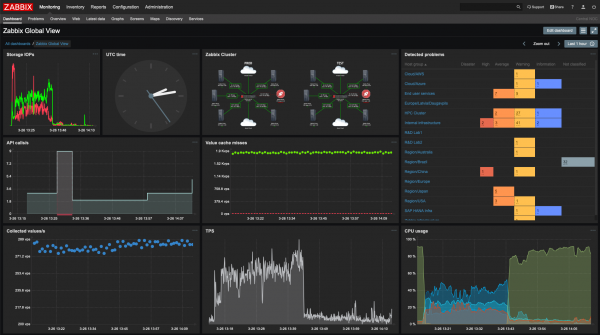
Zabbix
With Zabbix it is possible to create virtually unlimited data types from the system. Powerful real-time monitoring systems that allow you to simultaneously monitor tens of thousands of servers, virtual machines and network devices.
Zabbix is also suitable for monitoring Kubernetes infrastructure and application metrics.
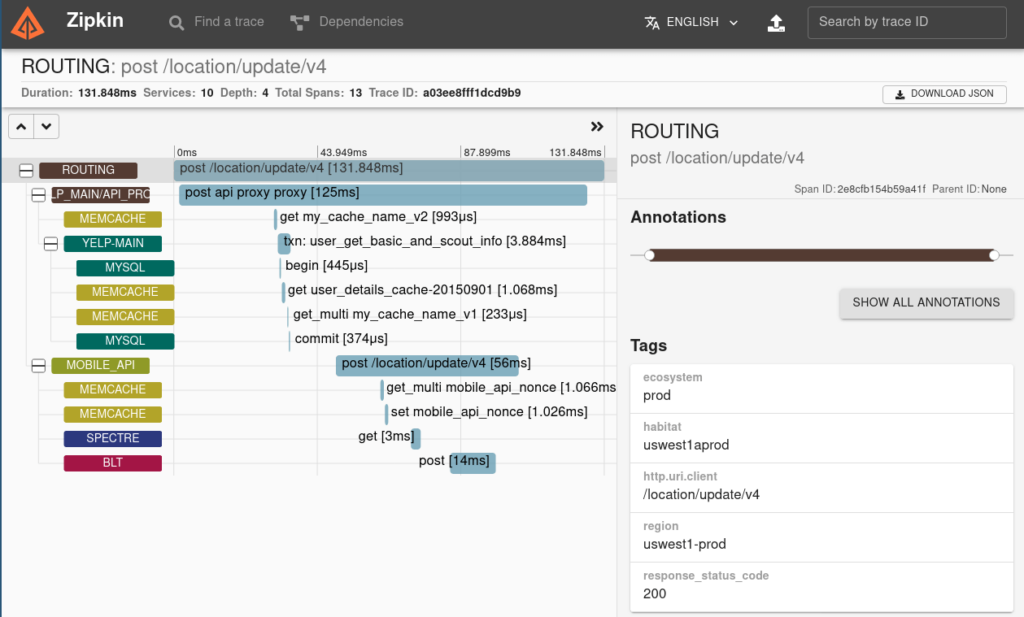
Zipkin
Zipkin is a distributed tracking system. It collects the synchronization data necessary to resolve latency issues in service architectures. Features include both collecting and finding this data.
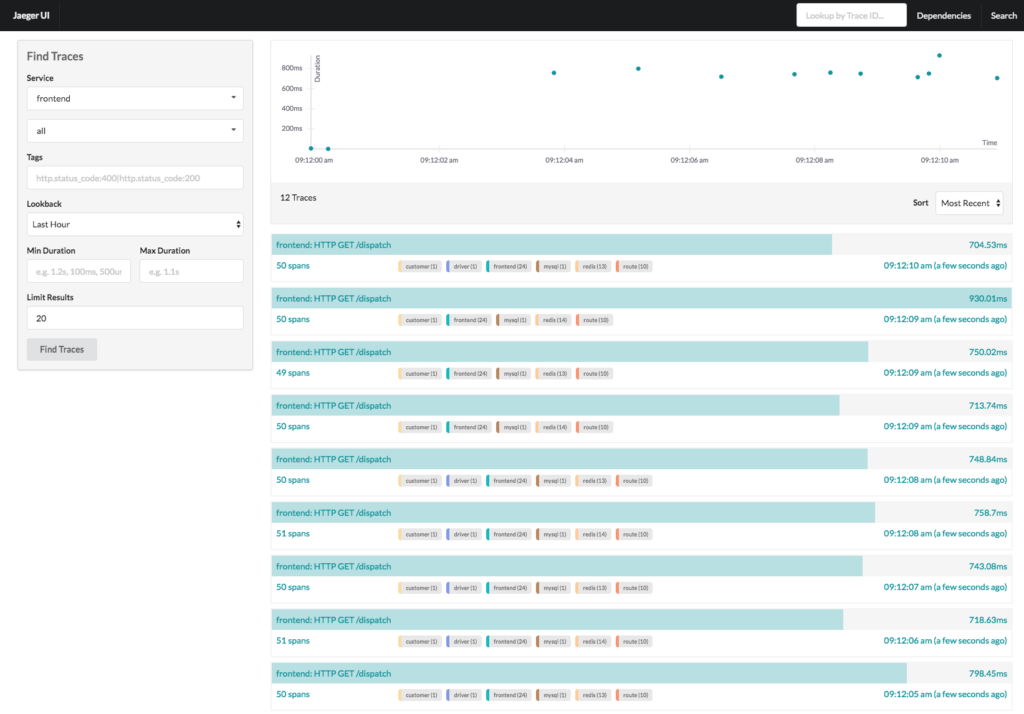
Jaeger
Jaeger is Open Source software publish by Uber Technologies. It allows transactions to be trace between several distributed services. It monitors and troubleshoot complex microservice environments.
To track the course of a request through different microservices, Jaeger employs distributed tracing. As this solution provides a visual representation of call flows, it eliminates guesswork.
Whether it’s troubleshooting or optimizing, having well-organized information helps. Jaeger includes tools for monitoring distributed transactions, optimizing performance and latency, as well as root cause analysis, a method of troubleshooting.
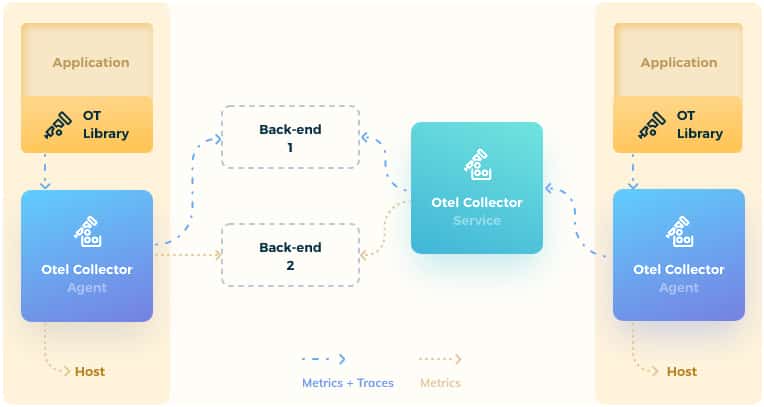
Opentelemetry
In 2019, OpenTracing (a vendor independent tracing project of the CNCF) and OpenCensus (a vendor independent metrics and tracing library led by Google) merged to form OpenTelemetry with the goal by offering a consistent set of libraries and instrumentation requirements to simplify the telemetry ecosystem for observability telemetry. The result is a complete telemetry system suitable for monitoring modern distributed services and more traditional environments. It streamlines the collecting and transfer of telemetry data for engineers by providing a unique set of APIs and libraries.
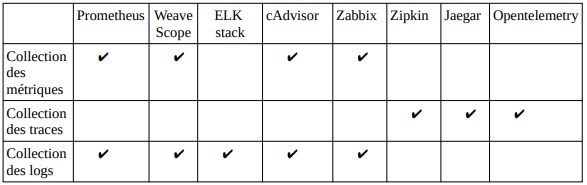
We can highlight the differences between these open source solutions in the table below :
Briefly, in this article – deployment of an APM based on Kubernetes – we have covered the principles of APM and Kubernetes monitoring. Next, we compared some of the most widely used open source options. And after benchmarking, we chose ELK stack for data logs and opentelemetry for performance code.
In the next section, we’ll go through the design and implementation phases of our solution, as well as the tools we used.
Check out the 2nd part of the article Deployment of an APM based on Kubernetes