CISCO Switch with Zabbix – How to Monitor?
What is Monitoring CISCO SWITCH?
Would you like to know more about how to monitor Cisco switches using Zabbix?
You are in the right place, but 1st let’s get to know more about this CISCO Switch, what it is, and then how to monitor it with this open-source software Zabbix.
CISCO Switch
Switch are essential components of every network. They link several hardware components, including printers, servers, wireless access points, and PCs, to a single network within a structure or campus. A switch enables communication and data transmission between connected devices.
There are two types of switches:
Unmanaged switch
Unmanaged network switch are created to be plug-and-play devices that don’t need any setup to function. Usually, unmanaged switch are used for simple connection. At your workstation, in a lab, or in a conference room, for example, or whenever a few extra ports are required, you’ll frequently find them employed in home networks.
Managed switch
Unlike unmanaged switches, managed switches can be configured to perfectly match your network, they provide you with additional functionality, flexibility, and security. With more management, you can safeguard your network more effectively and give network users better service.
SNMP
Simple Network Management Protocol is an internet standard protocol is used to gather, organize, and modify data about managed devices over IP networks in order to alter device behavior.
The reason why SNMP is so frequently used is because it’s called SIMPLE Network ides a SIMPLE Management Protocol, it is so easy and simple to configure. The SNMP architecture is simple and consists of only two main components which are an SNMP server and an SNMP client.
SNMP Server
In our case, Zabbix server will act as the SNMP server and will interface with Cisco switch, gather data from the agents and store them in a centralized fashion. It will also let us visualize them as graphs and create related thresholds
SNMP Agent
On the devices, SNMP agents are integrated or deployed, and their main duty is to reply to manager requests. In other words, the agent’s role is to gather system status information and data so that, when instructed by the management, it can reply right away.
Monitoring CISCO Switch with SNMP Template
In case you haven’t already set up your environment, there are three steps that we have to go through
- Zabbix Installation
- Enable SNMP on the CISCO Switch
- Zabbix Configuration
Zabbix Installation
You can download the latest version of Zabbix from the following link, you can also follow the official documentation on how to install Zabbix server.
https://www.zabbix.com/download
Enable SNMP on the CISCO Switch
To enable and configure SNMP on the Cisco Switch you have to connect to your switch’s command line via the console, telnet, or ssh, and log in as a user who has administrator rights.
A successful login will result in the console command-line being shown.
To access the privilege mode, use the ENABLE command.
The following commands will help to configure the SNMP service.
switch> enable
switch# configure terminal
switch(config)# snmp-server community MyCommunity RO
switch(config)# exit
switch# copy running-config startup-config
We set the community account to read only (RO) because all we need to do is read data from the cisco switch, we won’t be altering anything
We can test the SNMP communication between Cisco Switch and Zabbix server doing the following:
On the Zabbix server console execute the following commands.
Install an SNMP Client first
If you have Ubuntu/Debian use :
apt-get install snmpIf you have CentOS/RHEL use :
yum install net-snmp net-snmp-utilsTo verify the configuration of the SNMP on your device, use the following command.
snmpwalk -v2c -c MyCommunity 192.168.1.1 1.3.6.1.2.1.1.1
iso.3.6.1.2.1.1.1.0 = STRING: "Cisco IOS Software, Catalyst 4500 L3 Switch Software (cat4500-ENTSERVICESK9-M), Version 12.2(54)SG1, RELEASE SOFTWARE (fc1)
Technical Support: http://www.cisco.com/techsupport
Copyright (c) 1986-2011 by Cisco Systems, Inc.
Compiled Thu 27-Jan-11 11:39 "
replace 192.168.1.1 with the IP address of your switch.
The result should be something like this.
iso.3.6.1.2.1.1.1.0 = STRING: "Cisco IOS Software, Catalyst 4500 L3 Switch
Software (cat4500-ENTSERVICESK9-M), Version 12.2(54)SG1, RELEASE SOFTWARE(fc1)
Technical Support: http://www.cisco.com/techsupport
Copyright (c) 1986-2011 by Cisco Systems, Inc.
Compiled Thu 27-Jan-11 11:39 "
If it doesn’t work make sure that UDP port 161 in not blocked by the network or the local firewall on your device.
Zabbix Configuration
To configure Zabbix, first you have to sign in

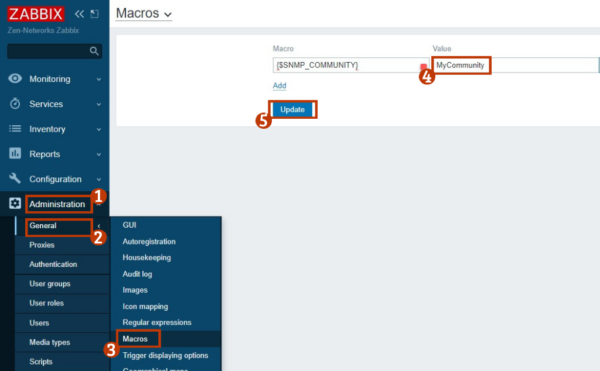
For Zabbix to be able to retrieve data from SNMP-enabled devices, a community string is required. Similar to a password, a community string. The default value for the global SNMP community string in Zabbix is “public,” therefore you will need to modify it if you use anything different, luckily, if you have been following along, we have already configured one on our switch.
By altering the value of the macro “$SNMP COMMUNITY,” you can modify the community string for all devices, by going to Administration > General > Macros

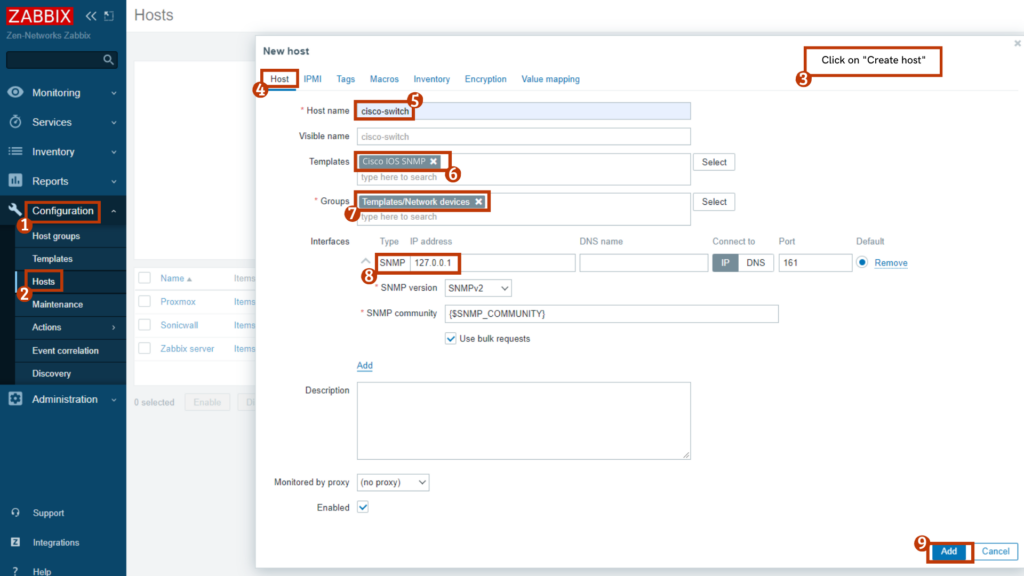
Go to Configuration > Hosts > Host, Create a new host and fill the information as needed:
- Host Name – Type a Hostname to locate the Switch.
- Repeat the hostname to make it visible.
- Create a new group by entering a name to categorize related devices.
- Agent Interface – Select Remove from the menu.
- SNMP Interface – Select the Add button and type the Cisco Switch’s IP address.

Next step, the host must then be connected to a specific network monitoring template.
Zabbix by default includes a wide range of monitoring templates, by going to Administration > General > Templates > Link new template
And then add the template name: Template Net Cisco IOS SNMPv2.
For now we have finished the configuration the initial result will appear on the Zabbix Dashboard after a while.
It will take at least an hour to appear the result.It will take at least an hour for the
result to appear.
Zabbix will by default wait an hour to determine how many interfaces are present on the switch.
Zabbix’s default behavior is to wait an hour before collecting data from Cisco Switch interfaces.
Congrats!! you successfully configured the Zabbix server to monitor your switch Cisco.
Zen Networks is a leading provider of advanced IT solutions, specializing in log monitoring, automation and DevOps.
Our expert team offers a wide range of services, including IT monitoring, cloud services, agile solutions, and automation. We are also well-versed in the installation and implementation of Elasticsearch, Logstask, and Kibana on Docker.
By leveraging our extensive domain expertise and innovative technologies, we empower our clients to optimize their IT infrastructure and achieve operational excellence. Our solutions are designed to help organizations of all sizes to streamline their processes, improve efficiency, and reduce costs.
We invite you to take advantage of our complimentary consultation and quote service to learn more about how we can help your organization to achieve its IT goals. Contact us now to schedule your consultation and discover the benefits of working with Zen Networks.
Error: Contact form not found.
Author


