Application Performance Monitoring : Full-Stack Visibility
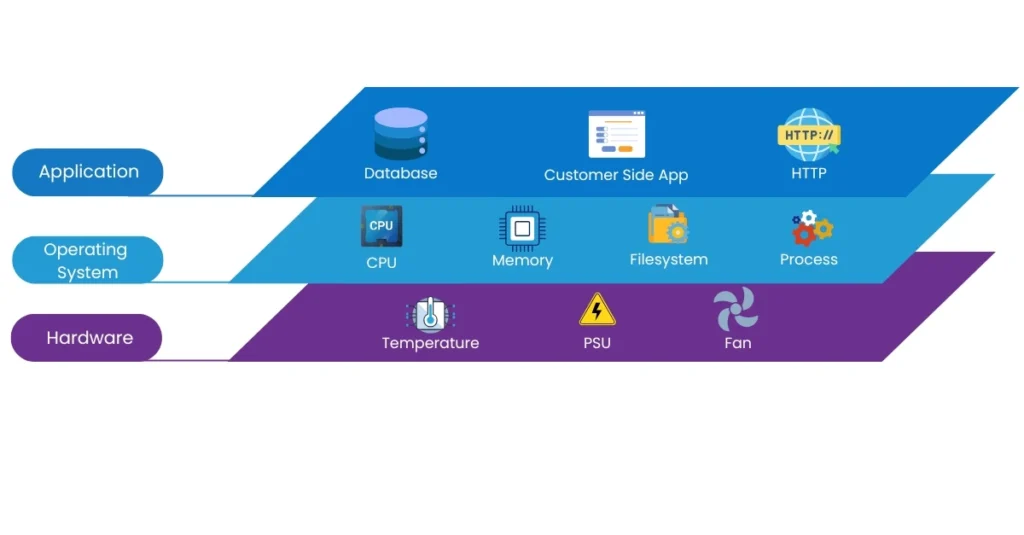
In today’s world, ensuring your infrastructure performs optimally is more critical than ever. Full-Stack Monitoring provides the comprehensive visibility necessary to manage and optimize every layer of your IT infrastructure. Application Performance Monitoring (APM) plays a key role in this process by allowing you to monitor and analyze everything from hardware components to the application layer. Let’s dive into the critical layers of your infrastructure and see how APM can provide 360-degree visibility.
Application Layer
The application layer is where end users interact with your services, and ensuring it runs smoothly is essential for user satisfaction. This layer involves monitoring databases, customer-facing applications, HTTP servers, and more. By focusing on UX and application behavior, you ensure your services are fast, reliable, and responsive.
- Application Performance Monitoring (APM): Helps track app performance in real time and detect issues before they affect users.
- OpenTelemetry: A collection of tools and APIs for gathering performance information from different providers.
- Code Instrumentation: Provides deeper insight into how specific lines of code affect performance.
- Probing: Monitors network traffic and response times to identify potential bottlenecks.
Operating System Layer
Behind every application, the operating system ensures smooth operations by managing the system’s resources, including CPU, memory, and network speed. Monitoring the OS layer is vital to make sure that servers and network gear are functioning optimally, preventing any disruptions in app performance.
Typical technologies used for monitoring the OS layer include:
- SSH: Used to securely access and monitor remote servers.
- WMI: Provides access to Windows-based system information for monitoring.
- Syslog & SNMP: Used to gather logs and performance data from network devices and servers.
- CloudWatch & vSphere APIs: Specific monitoring solutions for cloud environments.
Hardware Layer
The hardware layer monitors the physical components of your infrastructure, such as servers, power supply units (PSU), fans, and temperature. While it might not be directly involved in the user experience, hardware failures can severely impact performance if not proactively managed.
Technologies to monitor the hardware layer include:
- Redfish: A standard for managing and monitoring hardware components.
- SNMP: A network management protocol used to monitor and control hardware devices.

Full-Stack Monitoring
When you bring together monitoring across all these layers, you get a Full-Stack Monitoring approach. This methodology provides a comprehensive view of your infrastructure, enabling you to identify and resolve performance issues before they impact your business. From application glitches to hardware failures, full-stack monitoring helps ensure every layer works in harmony, boosting performance and optimizing the customer experience.
By continuously monitoring and analyzing each layer, you can:
- Preempt potential issues before they turn into outages.
- Optimize performance by detecting inefficiencies at every level.
- Deliver a great user experience by ensuring apps are responsive, systems are stable, and hardware is running smoothly.
Why Full-Stack Monitoring is Essential for Businesses?
Adopting a Full-Stack Monitoring strategy means staying ahead of potential problems and ensuring your business remains agile and responsive. With 360-degree visibility provided by APM and monitoring tools across the application, operating system, and hardware layers, you’ll be empowered to offer better, more reliable services, prevent costly downtime, and maintain a competitive edge.
Get in Touch Today!

Author


